


US$ Euro Yen
North America
Caribbean
Central America
South America
Western Europe
Eastern Europe
Russia
Former USSR
Middle East
North Africa
West Africa
East Africa
Southern Africa
South Asia
Pacific Rim
Commodities
Multinational
May 4, 2026. Next update: May 19, 2026. Visit Search to look at past issues of World Currency Observer (brochure edition).
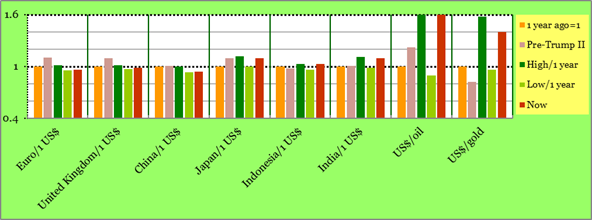
The principal impact on exchange rates of the interruption of petroleum shipments through the Strait of Hormuz (the impact worsened in April 2026, as, until that time, there had been a widespread expectation throughout March that the war and blockade situation would soon be ended) continues to be through petroleum prices around the world, which dipped at the end of March, and finished at the end of April more than 5% higher on the month – oil prices are sixty percent higher than they were a year ago. Aside from a general flight to the US dollar (safe haven incentives to hold the world’s most widely accepted currency) which pushed up most currencies around the world, there is the imbalance of petroleum producer currencies rising by more than the rise in those of non-petroleum producers (example: what will the boost in Russia oil revenues be on its war with Ukraine). An additional impact added in the latter part of April has been that the resulting rise in inflation has moved the expected trajectory for world-wide interest rates, from remaining steady, or even (perhaps) falling by marginal amounts (particularly hoped for in the United States), increasing consideration of whether rises in worldwide interest rates may happen – this is related to increasing uncertainty that the Hormuz situation will end soon, with one factor being that the 60 day United States deadline for considering an end of its war measures seems to have come and gone.
The Canada dollar was up by nearly 2.5% against the US$ in April 2026, and the Mexico peso was up by nearly 3% - the Mexico peso is up by 10.5% against the US$ since this time last year. Caribbean and Central America currencies were generally up or steady in April 2026 against the US$, including a 2.5% rise in the Costa Rica colón against the US$, and a 1.5% rise in the Dominican Republic peso (down 1.5 % since this time last year against the US$. The Jamaica dollar showed a slight net downward movement in April against the US$. South America currencies generally strengthened against the US dollar in April 2026, including a 4.5% rise in the Brazil real, which is up by 12% since this time last year. The Argentinadólar blue peso was down slightly in April against the US$, finishing the month at around 1400 per 1$US. The Chile peso moved up by 3.5% in April against the US$. The Euro rose by 1.75% against the US dollar in April 2026 - this was generally less than the rise in the US$ value of almost every other Europe currency in April, implying that they almost all rose (by 1% in general) against the Euro – one examples is the United Kingdom pound. The Norway krone, as a strongly petroleum price-linked currency, was up by 4.5% in April and is up by 10.5% against the US$ since this time last year. The Hungary forint, in the wake of the election of a new government on April 12, rose by a very large 8% in April against the US dollar, and is also up by more than 6.5% against the Euro. Both the Czechia koruna and the Poland zloty were up by 2.75% against the US$ in April, and were up by 1% against the Euro. Currencies in former-USSR countries were up against the US$ in April, and the currencies with the biggest rises were led by Russia (supplying oil to countries cut off by the events in the Strait of Hormuz), with a 7.75% rise against the US$ in April 2026. Other former-USSR currencies up against the US$ included the Belarus rouble (up by 4.5% in April 2026) and a 3.5% increase in the US$ value of the Kazakhstan tenge in April. Currencies in the Middle East were generally stronger against the US$ in April 2026, including a 2.75% rise in the Egypt pound (down 4.5% since this time last year), and a 6.5% rise in the Israel shekel (up 18% since this time last year). The South Africa rand was up by 2% against the US$ in April 2026, and up by 10% since this time last year. The Australia dollar strengthened by 4.5% in April, and is up by 11% since this time last year. Among Asia countries, the China yuan was up by 1% against the US dollar in April (up by 6% since this time last year – what does this say about whether, as some argue, that the renminbi yuan is undervalued), and the Taiwan dollar was up by 1.25%, and up by 1% since this time last year. In Japan, despite the 6-3 decision by the Bank of Japan to avoid hiking its benchmark overnight interest rate, the yen was up by 1.75% in April, but is down by 9.75% since this time last year. The South Korea won was up by 3% on the month, and is down by 3.5% against the US$ since this time last year. The India rupee continued its year long decline against the US$, and is down by 12.5% against the US$ since this time last year. The Myanmar kyat dropped by 5.5% against the US$ in April (see below). The Vietnam dong is down by 1.5% against the US$ since this time last year, after showing no net movement against the US dollar in April 2026. The Malaysia ringgit was up by 2.5% in April 2026, and is up by 8.5% since this time last year. With regard to prices of commodities: one example of a commodity with a large US$ price increase in April was cotton, up 11% - China and then India are the top exporters. Also, rice prices in US dollars were up by 7.5% (WCO summary of publicly available data) – India is the world’s top rice exporter.
Myanmar (which was Burma until 1989) has a long coastline on the Bay of Bengal in east Asia, and is bordered by China, Thailand and India. As noted above, the Myanmar kyat moved down sharply in April (the generally quoted parallel rate is currently 4340 per 1$US, while the central bank-quoted referernce rate, which applies to selected transactions, such as exports, imports and remittances, is at 2100. The above-noted 5% decline in the April 2026 US$ value of the kyat is out of line with the April strength of many other currencies around the world, but is more consistent with currency movement in India.. Despite the fall in the kyat in April, the net decline in the kyat from its value at this time last year is relatively small. Also, the Myanmar kyat (market rate) had been strengthening from 4200 in August 2025 to around 3800 in January 2025, then remained rather steady, until declining somewhat at a time roughly consistent with the United States military action at the end of February (this is despite the fact the Myanmar principal export is oil, although it has a range of other exports), including textile products. Its lengthy north-south orientation, and elevation (including brief snow periods each year in the northern mountains), give Myanmar a mix of sub-tropical and tropical agricultural products, which are reflected in its exports. All of the above strength and then weakness in the kyat preceded the end-of-April news that the European Union would renew EU sanctions for another year. The EU sanction regime used to be very onerous, but most EU (and United States) sanctions, except for the arms embargo, were lifted around 15 years ago. Selective EU sanctions were then imposed again in 2018, targeting civil liberty restrictions and actions of the military junta.
(World Currency Observer will next be updated on May 19, 2026. Visit Search to look at past issues of World Currency Observer (brochure edition). For permission-to-quote enquiries, e-mail World Currency Observer at WCO@briargreen.com.)


