


US$ Euro Yen
North America
Caribbean
Central America
South America
Western Europe
Eastern Europe
Russia
Former USSR
Middle East
North Africa
West Africa
East Africa
Southern Africa
South Asia
Pacific Rim
Commodities
Multinational
May 4, 2021 (see May 19 update below) Next update: June 2, 2021. Visit Search to look at past issues of World Currency Observer (brochure edition).
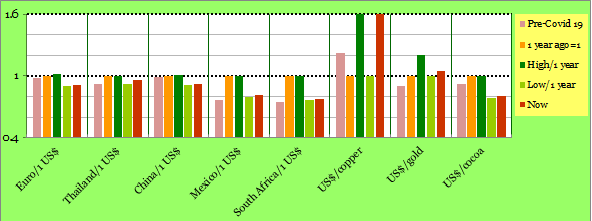
Currencies around the world, with few exceptions, strengthened against the US$ in April 2021, and straight year-over-year comparisons reflect how currencies have changed since the worldwide lockdowns at the depths of the pandemic. So it is a good moment to look at a more meaningful comparison of how individual currencies have moved, which is from the values they were at before the pandemic (in some senses, their "normal" values) up until now. The World Health Organization declared the Covid-19 outbreak to be a Public Health Emergency of International Concern on 30 January 2020 (and declared that the world was in a pandemic on 11 March 2020). Anecdotal evidence suggests that, for the most part, it is hard to find any country around the world that took large scale steps before the end of January 2020 to cope with the Covid-19 outbreak (although, of course, every country had individuals who were raising the alarm and making plans). So, instead of our normal year-over-year assessment of currency movements, this month WCO (brochure edition) is looking at the changes in currency values from the start of 2020, which are useful benchmarks of their pre-pandemic levels. At the present moment (May 2021), the world does not appear to be, in most senses, at a post-pandemic phase. India has dominated the news in recent days, but, even in the United States and United Kingdom, where lockdowns are scheduled to end and vaccines confront the new variants, the data suggest that significant Covid-19 cases and deaths continue to occur, even where they are slowing.
In North America, the Canada dollar has risen by over 5% since before the pandemic against the US$, and the Mexico peso has fallen by 7% since before the pandemic. The Jamaica dollar has fallen 16% from the level it was at before the pandemic (down 6% against the US$ in April 2021). The Trinidad and Tobago dollar is at roughly the same value against the US$ as it was before the pandemic, and the Nicaragua córdoba oro is down by 3% (up slightly in April). The Costa Rica colón is down by 8% from the value it was at against the US$ before the pandemic. In South America, the Brazil real is down by 35% against the US$ since before the pandemic, and the Chile peso is up by 5.5% (after rising by 3.5% against the US$ in April). The Paraguay guarani is down slightly against the US$ since before the pandemic, after a 4.5% decline in April. The Peru sol is down by 13.5% against the US$ since before the pandemic, and the Uruguay peso is down by 18%. The Euro has risen by 7% against the US$ since before the pandemic (up by 2.5% against the US$ in April; the Euro area – the 19 and also the 27, but with considerable variation among individual countries - has entered a recession, with news of "negative growth" in the first quarter of 2021), and the UK pound is up by 4%; the Swiss franc is up by 6% since then (after a 3% rise against the US$ in April). The Turkey lira has fallen by 38% against the US$ from the level it was before the pandemic (up by 1% in April 2021), while the Hungary forint has shown no net change since before the pandemic, and the Poland zloty is up by 1%. Other east and central Europe currencies have, roughly, matched the movement of the Euro against the US$ from their levels before the pandemic. Currencies of former USSR countries (such as Russia and Ukraine) have generally fallen by 10-20% against the US$ from their levels before the pandemic. Among these, however, the Azerbaijan manat has shown zero net movement against the US$ since the time before the pandemic, and the Moldovan leu has fallen by 3% (Moldova is between Ukraine and Romania, thus on the border of the European Union). The Egypt pound is up by 6.2% against the US$ from its value before the pandemic (up 0.5% in April 2021), and the Israel shekel is up by 6.2% from its pre-pandemic value (up by 2.5% in April 2021 against the US$). Africa currencies have shown a very mixed range of movement from their values against the US$ since before the pandemic. The Nigeria naira is down by 13.5%. The Tunisia dinar is up by 2.5%, but this is based mostly on its strengthening of 2% in April 2021 (much the same story for the Uganda shilling). The Algeria dinar is down by 12% against the US$ since before the pandemic. The Sierra Leone leone is down by 5% since before the pandemic. The South Africa rand is down by 3.5% since before the pandemic (after rising by 2% in April 2021). There is a long list of currencies in the Pacific Rim which have all risen substantially against the US$ since before the pandemic. These include the Australia dollar, the New Zealand dollar, the China yuan (generally regarded as the country where the pandemic virus originated - the yuan is up by 7% against the US$ since before the pandemic), the Taiwan dollar, the South Korea won and the Philippines peso. Currencies which have fallen against the US$ since before the pandemic in this region include the Indonesia rupiah. The Vietnam dong is up slightly since before the pandemic (and is down by 1% against the US$ over the last month). The India rupee is down by nearly 4% since before the pandemic (down just 1% during April 2021, despite the large rise in Covid-19 cases and deaths), and the Thailand baht is down by 5% since then. The Malaysia ringgit has shown no net change against the US$ since before the pandemic, and the Singapore dollar is up by 1% since before the pandemic, after rising by 1% in April.
There is a great deal of discussion on whether there is a supercycle (prices well above trend) happening in commodity prices. One question is whether such assessments should be based on price increases since the March 2020 depths of the pandemic, or, should they be based on price increases since before the pandemic? While many commodities that are followed by WCO have seen increases of US$ prices of 25% or (in some cases, much more), since their levels before the pandemic (which includes metal prices and maize-soybean-wheat prices), the big exceptions include oil and gold, and some of the tropical commodities. Oil prices have shown essentially no net increase in price since before the pandemic, and gold prices are up by 17% (silver is up by much more, 45%, reflecting its link to the industrial metals). Among the tropical soft commodities, cocoa prices are down by a net of 14% since before the pandemic, and coffee, rice and rubber prices are up, in the range of of 10 to 15% in US$ terms. Perhaps the very large commodity price increases, which seem to be concentrated in certain metals and tropical commodities, are not general enough to be declared a supercycle.
Among the few currencies around the world that declined in April, the Suriname dollar fell (in value) from around 14/1$US to 16 in April 2021, a decline of 16%. Suriname (population 600 thousand; one of the three former “Guiana countries” on the northeast coast of South America), is two months into its transition from a fixed exchange rate of (midpoint) 14.1/1$US, to a managed float in the central-bank-declared range of 14.29 to 16.3/1$US. Prior to this, the Suriname dollar had been set at around 7.4 for many years, and was devalued to 14.1/1US$ at the end of September 2020. On March 1, along with the implementation of the managed float, the government of Suriname also tightened its control of foreign exchange flows, with requirements for conversion by exporters of foreign currencies into Suriname dollars, and for importers to source foreign exchange only from designated foreign exchange banks. The background to the new Suriname currency regime includes an announcement by the International Monetary Fund, suggesting that it is close to a US$690 million Extended Fund Facility financing agreement with Suriname, which could lead to a US$57.5 million transfer to Suriname, likely in June. More generally there were also indications, early in April, that a US$650bn increase in IMF Quotas, spread over all of its member countries (more than 150), is likely to be approved. There are some criticisms that the amount is too low, and that a US$3bn increase is needed to ensure that enough additional financing, after allocation among IMF members, is available for developing countries. (The Quotas are denominated in SDRS, based on a weighted basket of the market values of five currencies, currently the equivalent of around US$1.42 for 1 SDR.)

The United States inflation rate has a tremendous influence on exchange rates around the world, which are traded and denominated on an amount of currency per 1$US measurement, so interpretation by markets of the recent announcement that U.S. consumer prices rose by 4.2% over the year ending in April 2021 (i.e., from their level in April 2020, which was just after a big part of the 2020 shutdown of economies around the world) is of importance, one reason for this being that 4.2% movement was well above the (published) expected consensus of around 3.5%. A question for WCO is whether the 4.2% level is really an indication of where U.S. inflation is at, or is it just a statistical fluke, that will turn around in the next month. WCO sees at least two ways of looking at this. First, using the “methodology” suggested above, and pushing the benchmark price level back from April 2020, to its level in December 2019 (before the Covid-19 pandemic), prices rose in the 16 months from December 2019 from April 2021 by 3.9%, and, moving this to a 12 month basis, there is an annual inflation rate of 3.1% - not as high as 4.2%, of course, but still well above the US Federal Reserve target of 2%. But, for us, a more meaningful interpretation comes from noticing that the monthly inflation rates for the last two months were very high – 0.6% in March and 0.8% in April, which is 1.4% over these two months and which, compounded to an annual rate, would suggest an annual U.S. inflation rate of 8.7%. Set these against a backdrop of U.S. economic growth (job growth) which may not be as high as expected, and U.S. inflation does look to be high. But, it must be said, these gloomy implications are based on just two months of price data at a time of unprecedented uncertainty in the world economy due to the pandemic, so any final conclusion on where US prices are going will, reasonably, have to await price data for, say two more months, i.e., until the middle of July 2021.
(World Currency Observer will next be updated on June 2, 2021. Visit Search to look at past issues of World Currency Observer (brochure edition). For permission-to-quote enquiries, e-mail World Currency Observer at WCO@briargreen.com.)


